Until the action at U.S. nationals starts up this Wednesday all we have to scratch the swim nerd itch is the psych sheet. My SwimSwam colleagues have written extensively about who we expect to do well in each race, but there’s more info on the psych sheet than times. There are also ages, so, let’s take a deeper look at that data.
There are 434 men entered in at least on event. The youngest are 15 year olds Dare Rose of Scarlet Aquatics and Tim Connery of SwimMAC Carolina. The oldest is 37 year old Anthony Ervin of Team Elite.
Men’s entries have an average age of 19.9. That average counts swimmers with multiple entries multiple times. If we average the ages of swimmers with at least one entry at the meet, the men have an average age of 20.0 years.
Swimmers seeded outside the top 20 almost never qualify for the international meets, so the ages of all swimmers don’t give a look at the main contenders. (That claim is based on trials data. At this meet, unlike trials, there are some fast swimmers seeded low because of yards entry times that could upset this norm. Though for the most part, don’t expect many podium finishers from outside the top seeds). If we want to look at contenders we need to narrow our focus to top seeds. The average age of top 20 seeded men is 21.3. The average age of top 3 seeded men is 23.4.
439 women are entered. The youngest is 13 year old Rye Ulett of Dynamo Swim Club. The oldest are 30-year olds Liz Roberts of Savannah and Madison Kennedy of SwimMAC Carolina.
Women’s entries have a average age of 18.9 and women with at least one entry have an average age of 19.2. Top 20 women’s seeds have an average age of 20.4. Top 3 women’s seeds have an average age of 22.4.
| Age | Men | Number of Top 20 Seeds | Women | Number of Top 20 Seeds |
| 13 | 0 | 0 | 1 | 0 |
| 14 | 0 | 0 | 7 | 3 |
| 15 | 2 | 0 | 19 | 10 |
| 16 | 16 | 8 | 38 | 22 |
| 17 | 30 | 5 | 36 | 22 |
| 18 | 47 | 38 | 57 | 34 |
| 19 | 82 | 46 | 77 | 32 |
| 20 | 85 | 48 | 100 | 55 |
| 21 | 95 | 65 | 57 | 60 |
| 22 | 32 | 39 | 17 | 29 |
| 23 | 13 | 30 | 13 | 35 |
| 24 | 13 | 24 | 3 | 8 |
| 25 | 4 | 7 | 1 | 0 |
| 26 | 3 | 9 | 5 | 14 |
| 27 | 2 | 4 | 3 | 8 |
| 28 | 3 | 4 | 2 | 5 |
| 29 | 3 | 6 | 1 | 2 |
| 30 | 1 | 0 | 2 | 1 |
| 31 | 0 | 0 | 0 | 0 |
| 32 | 0 | 0 | 0 | 0 |
| 33 | 2 | 6 | 0 | 0 |
| 34 | 0 | 0 | 0 | 0 |
| 35 | 0 | 0 | 0 | 0 |
| 36 | 0 | 0 | 0 | 0 |
| 37 | 1 | 1 | 0 | 0 |
| Total | 434 | 439 |
For both men and women the average age of top 20 seeds is at least a full year older than the field as a whole. That doesn’t mean that top swimmers at this meet are atypically old. In fact, for a nationals meet, this meet is pretty young. The average age of top 20 seeded men at 2016 Olympic trials was 22.6, 1.3 years older than at this meet. The women’s average top 20 age at 2016 trials was 21.3, .9 years older than at this meet. The average age of all men at 2016 trials was 20.4 and women was 19.2, both slightly higher than at this meet.
This trend repeated at the previous 2 mid Olympic cycle U.S. Nationals vs the previous Olympic Trials.
Average Age Top 20 Seeds
| Men | Standard Deviation | Women | Standard Deviation | |
| Nationals 2018 | 21.3 | 3.2 | 20.4 | 3.0 |
| Trials 2016 | 22.6 | 3.9 | 21.3 | 3.4 |
| Nationals 2014 | 21.7 | 3.5 | 20.1 | 2.9 |
| Trials 2012 | 23.0 | 3.6 | 21.1 | 3.8 |
| Nationals 2010 | 22.0 | 2.9 | 20.0 | 3.0 |
| Trials 2008 | 22.4 | 2.7 | 20.6 | 3.5 |
This age gap mostly persists if we narrow our view from the top 20 to the top 3. Men’s top 3 seeds at 2016 trials averaged nearly 2 years older than at this meet (old man Phelps certainly affected this stat). Women’s top 3 seeds were actually very similarly aged at a gap of only .2 years. It’s hard to make too many conclusions about the top 3 data as the sample size is much, much lower than the top 20 data.
Average Age Top 3 Seeds
| Men | Standard Deviation | Women | Standard Deviation | |
| Nationals 2018 | 23.4 | 3.2 | 22.4 | 2.7 |
| Trials 2016 | 25.3 | 4.4 | 22.6 | 3.3 |
| Nationals 2014 | 24.4 | 3.9 | 21.3 | 3.2 |
| Trials 2012 | 25.8 | 3.0 | 22.3 | 3.8 |
| Nationals 2010 | 23.9 | 3.0 | 20.5 | 3.3 |
| Trials 2008 | 23.7 | 2.3 | 22.1 | 4.3 |
Both Trials and Nationals tend to have large numbers of young swimmers but Trials has more older swimmers who’ve stuck around for one last shot at an Olympics. The standard deviation of the ages reflects this, especially for women. The standard deviation of Top 20 women’s ages at each of the last 3 trials has been above 3.4. At the last 3 mid cycle nationals it was 3.0 or below.
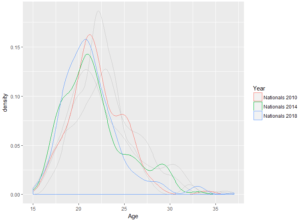
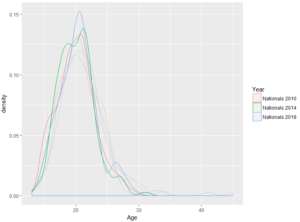
The men’s standard deviations have been a bit higher at nationals than trials, but not as clearly as the women. The age gap for men is accounted for by a shift right in the trials age distributions-fewer younger swimmers more older swimmers. This contrasts the women’s age shift which is explained by a heavy right tail- similar number of younger swimmers, more older swimmers. This can be seen in the distributions below.
Men’s Age distributions Top 20 Seeds (grey is Trials)

Women’s Age Distributions Top 20 Seeds (grey is Trials)


Next challenge, the GEOGRAPHY of the swimmers.
Did that already. See the fall 2017 magazine.
The only remarkable thing that deserves real attention and explanation in this statistics is more than 20% drop of std of the distribution in women’s case. It may mean that we are lucky to witness the generation of very exceptional swimmers that dominate the competition for years already.
If that were the case, we wouldn’t see the standard deviation yo yo up and down the way it has for the last 10 years. Every mid cycle nationals for top 20 seeds it’s at 3.0 or lower and every trials it’s at 3.4 or higher. The top 3 seeds follow the same pattern. If it was a single generation of talent, there would be a longer term trend, not the short term cycles we do see.
I didn’t get the logic behind “yo yo” model, but this is ok: please don’t bother to explain.
If one talented generation stays long enough in command then the following will happen. The older strong swimmers retire or strongly decline losing their contribution to the distribution. Most of young swimmers needs time to mature to the level of the elite group. Young prodigies do happen, but it is mostly an exception then the rule. So there would be no disturbance to the group of swimmers who are on the top. That will be reflected by the distribution with small deviation.
When there are more older swimmers, the standard deviation of the top 20 seeded swimmers is higher. This is because there are always a majority of swimmers age 22 or younger. Note that all 6 women’s distributions in the last graphic peak at age 20. If there were a golden generation of top swimmers, we would expect them to push older swimmers into early retirement. Fewer team spots available. Fewer reasons to remain in the sport. When this hypothetical golden generation is young, this would lead to a low standard deviation. They push out the older swimmers and are young themselves, matching the majority of the field. Then as they age the standard deviation should rise slowly as they age… Read more »
I know that you guys did a prediction of Jr Pan Pacs based off of top times in the country, but you could do one based off of the physic sheets now that we know what everyone’s swimming. Just a suggestion